The scheduling Gantt chart visualises the outcome of the schedule. It details the work and delays carried out by each resource across the schedule, showing resource utilisation over time. It also indicates when each activity is performed and for how long.
The chart includes dedicated rows for productive tasks (activity areas) – as well as rows for each resource, showing when it’s working on an activity area, experiencing delays, or performing other types of tasks. You can adjust the level of detail displayed in the chart, switching between daily, weekly, or other time-based views.
The Gantt chart displays the base production rate used for each resource-task combination, which can be overridden. It also shows the actual production rate, which is based on several time usage and rate factors. You can readjust the allocation and sequencing of tasks among resources. The software automatically re-runs the schedule to reflect those changes.
Delays can be inserted directly into the chart. The layout is fully customisable, allowing you to report specific columns such as resource, activity area, pit, and more. Tooltips provide further insights, including actual resource utilisation and greater details about the production rates applied to each task.
This topic covers the scheduling Gantt chart, an interactive chart that reports on the timeline schedule and allows you to modify its decisions. For information on customisable Gantt charts used specifically for reporting purposes, refer to Gantt Reporting tab.
To access the scheduling Gantt chart, in Client, go to the Gantt tab.
The Gantt chart visualises what each resource is doing throughout the schedule, such as work performed on each activity area.
The chart comprises rows, and each row represents either a resource or activity area.
Resource Rows: Represent individual equipment or personnel. Each row shows all tasks assigned to that resource.
Activity Area Rows: Nested beneath their corresponding resource, these rows show tasks performed on specific areas.
The chart uses the active calendar’s time intervals (periods) to plot the tasks against the time intervals, showing when resources perform tasks – or when activity areas are performed.
In terms of resources performing tasks, these include productive activities (like digging out an activity area) and non-productive activities (like delays, such as maintenance or rostered downtime).
The chart includes horizontal and vertical axes.
Vertical axis: Lists the site’s resources – as well as the tasks (activity areas) performed by resources.
Horizontal axis: Details attributes of each task—such as the start dates, finish dates, and production rates—and represents the schedule’s timeline.
Each task is displayed as a horizontal bar, indicating its duration and position within the schedule. Each task bar has a tooltip, which shows greater detail about the given task.
An example Gantt chart
|
Bar |
Description |
|---|---|
|
Scheduled |
Indicates that the resource is working on a scheduled activity area. The bar of the scheduled activity area displays on a child row, between the same start and end dates. |
|
Activity Area |
Indicates that the resource is scheduling a specific activity area. The bar shows the name of the activity area. The bar is allocated to a child row, beneath the resource row, that corresponds with the associated activity area. To assign activity areas to resources, refer to Resources tab. The label appears as the name of the activity area. |
|
Resource Availability Delay |
Indicates that the resource isn’t operational during this time, because its Availability, Utilisation, and Efficiency factors are set to 0 – or its entered production rate is 0. These factors are defined in Resources tab. |
|
Maintenance Order |
Indicates that the resource is performing a predetermined maintenance order, such as an oil change. Orders are prepared in Maintenance Orders tab. The label appears as the name of the maintenance order. |
|
Rehandle Operations |
Indicates that the resource is performing a rehandle operation, reallocating material from stockpiles to other intermediate or final locations. Site configuration . |
|
Optimiser Delay |
Indicates that the resource isn’t operational during this time, because the Product Optimiser is reducing its production in an attempt to achieve quality objectives. Refer to Site configuration . |
|
Unallocated |
Indicates that the resource isn’t allocated to or doing any task. |
You can control how much detail is shown on the chart.
A delay task refers to a moment in time when a resource is idle. Delays can be generated automatically, such as in the case of maintenance orders or roster changes, or they can be manually added to the Gantt chart.
For more information about delays, refer to Delays below.
Delays may occur regularly, like a shift change every 12 hours. These interruptions can create gaps in the Gantt chart, breaking up the visual continuity of work in the activity area bars.
When analysing productivity—or when viewing the chart at a lower zoom level—it can be more useful to focus on the actual productive work rather than all types of activities. In such cases, showing frequent delays on the chart may be irrelevant or distracting.
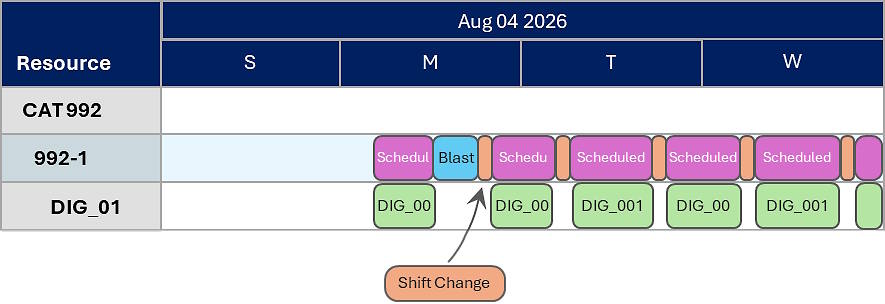
Viewing the Gantt chart at a high zoom level. All delays within tasks are shown.
To simplify the view, you can choose to exclude delays from within tasks. When this option is enabled, only the summary bars for activity area tasks are shown, with any internal delays effectively encapsulated within them. This provides a cleaner, more focused representation of work, especially when delays are frequent or routine.
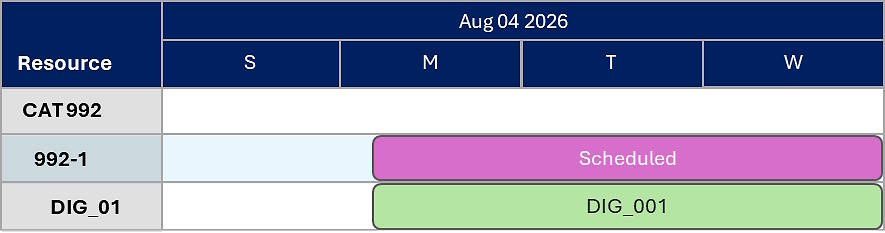
Excluding delays within tasks from the view. The tasks shown are their “summary” versions
On the toolbar, click Toggle Gantt Display Mode to control how delays are shown on the Gantt chart.
Detailed View ![]() : All delays within tasks are visible, regardless of the zoom level. Tasks are visually separated by the delays that occur within them.
: All delays within tasks are visible, regardless of the zoom level. Tasks are visually separated by the delays that occur within them.
Summarised View ![]() : Tasks are shown in a summarised form, where any delays within them are encapsulated and hidden – regardless of the zoom level.W
: Tasks are shown in a summarised form, where any delays within them are encapsulated and hidden – regardless of the zoom level.W
Automatic ![]() : Summary tasks are shown by default. When the Gantt chart is zoomed in to display less than 14 days, all delays within tasks become visible automatically.
: Summary tasks are shown by default. When the Gantt chart is zoomed in to display less than 14 days, all delays within tasks become visible automatically.
Each productive task includes an effective utilisation value, which indicates how much of the resource’s available operating time is actively spent performing the assigned activity (refer to Task details below).
The reported effective utilisation can vary depending on how the task is displayed:
Summary tasks: These encapsulate any delays within the task. Since the resource is idle during those delays, the reported effective utilisation is reduced, reflecting the total time the resource was not actively working.
Full tasks: When a task is broken into segments around delays, each segment represents only the productive portion. As a result, the reported effective utilisation is not weighed down by idle time and reflects a clearer view of actual working efficiency.
You can adjust how activity areas are allocated and scheduled within resources using the Gantt chart interface.
After moving an activity area task to another resource, the task’s duration may change – depending on the difference between the original and target resources’ production rates.
You can:
Reassign activity areas to different resources.
Change the order of activity areas within the same resource.
This is done by dragging and dropping activity area bars to new positions or rows in the Gantt chart.
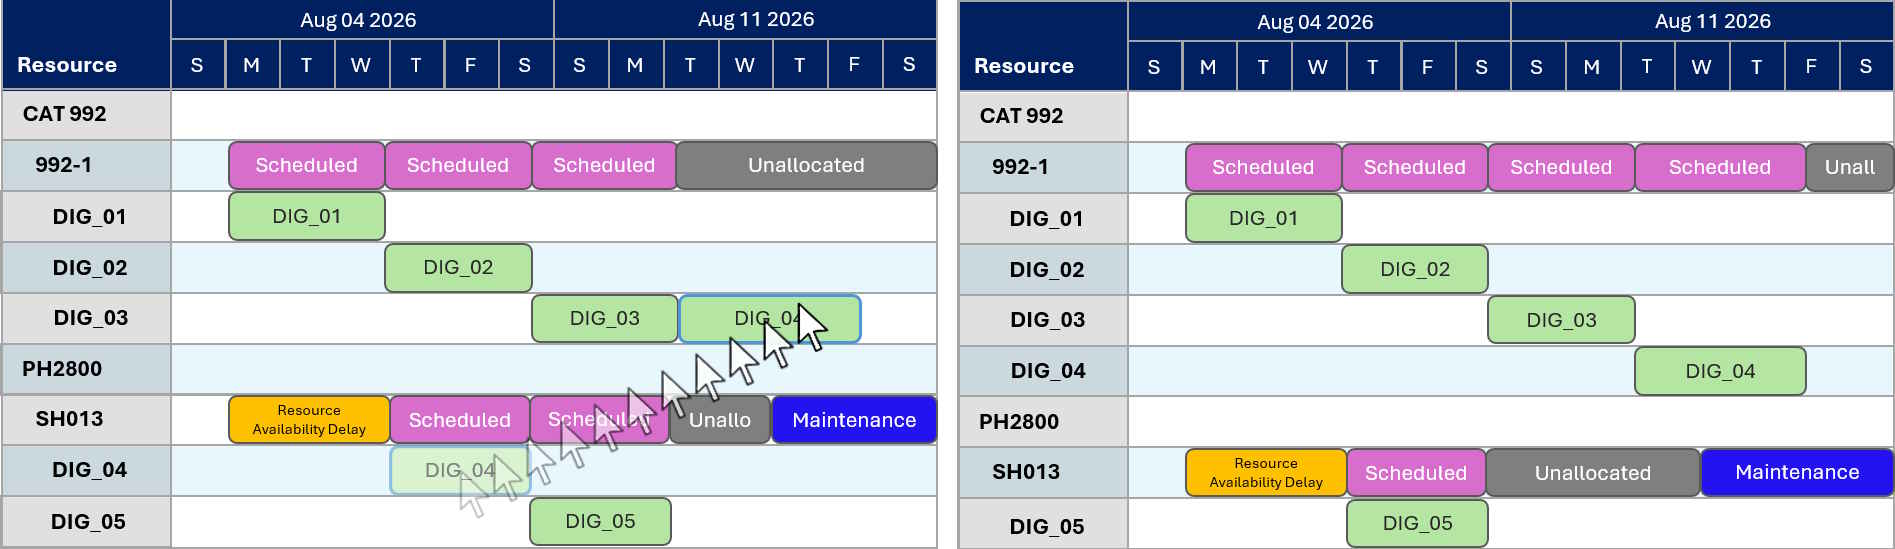
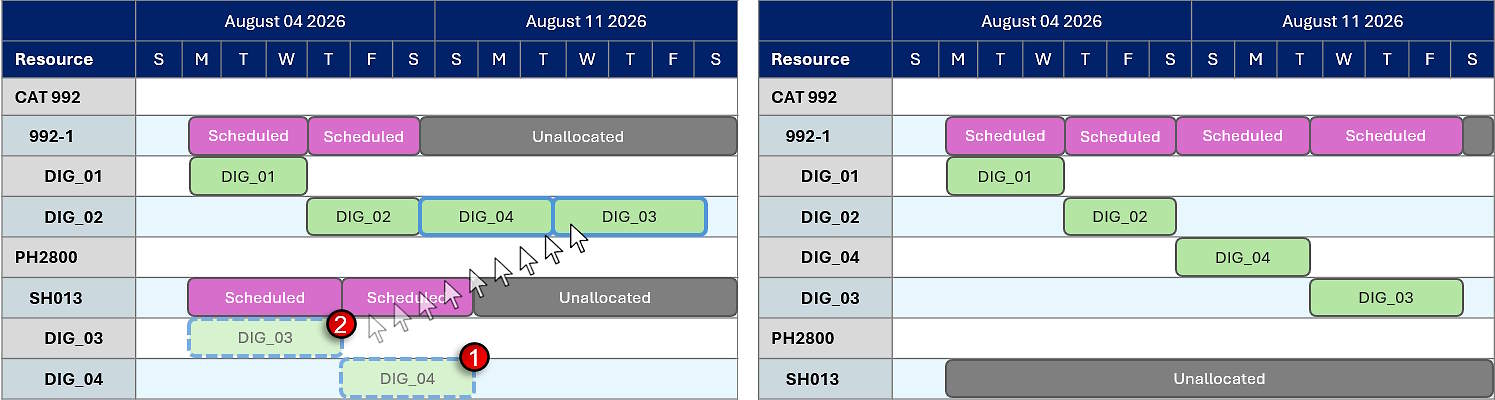
Before and after dragging and reallocating DIG_04 to another resource
Activity areas can be inserted before or after other tasks, provided the target resource is configured to handle that activity.
When you drag an activity area (e.g., DIG_04) to a different resource:
The chart automatically updates to reflect the change.
Surrounding tasks are shifted forward or backward to accommodate the new schedule.
Delays remain fixed: they aren’t rescheduled because their timing is predetermined.
If the original resource no longer has any scheduled corresponding activity areas, that activity area row is removed from the resource.
If the target resource didn’t previously include that activity area, a new row is added for it.
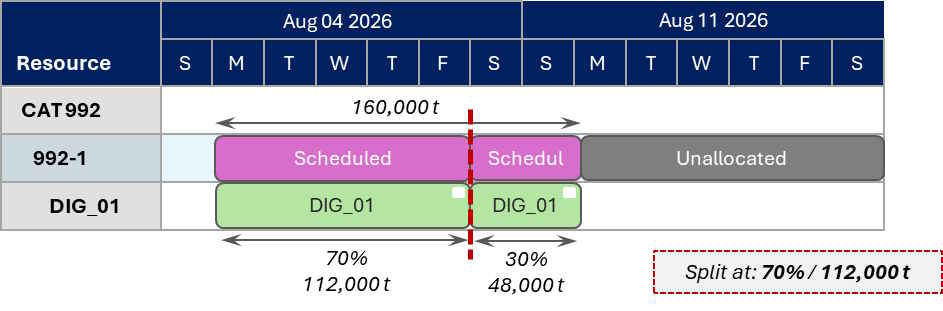
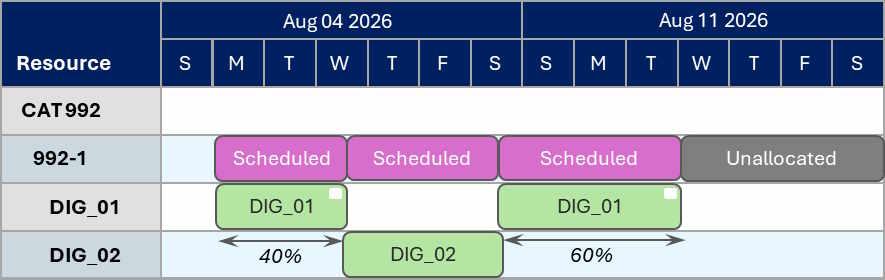
When you drag a task to a new position, you have the option to create a copy. In this case, the original task remains in its original position, while a copy of the task is placed in the new position. The scheduling percentages of both tasks will adjust accordingly, with each task being assigned 50% of the total workload to ensure that they add up to 100%.
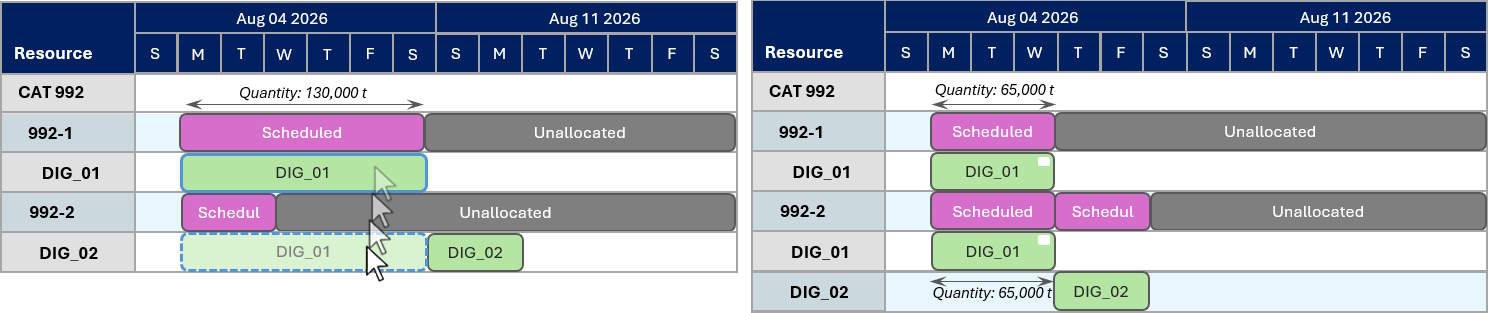
Copying the DIG_01 task to another resource.
To copy a task to a new position, hold Ctrl as you drag the task.
You can select multiple tasks and simultaneously move them to another resource. The order of the tasks, within the resource bar, is determined by the order in which you selected the tasks.
To select multiple tasks, hold Ctrl when clicking to select multiple items.
Dragging multiple tasks to another resource
You can reassign an activity area task to a different resource using the Assign Task option from the right-click menu. This option removes the selected activity area from the original resource and adds it to the target resource. It’s placed at the end of the task list for that resource, following any existing activity area tasks already scheduled there.
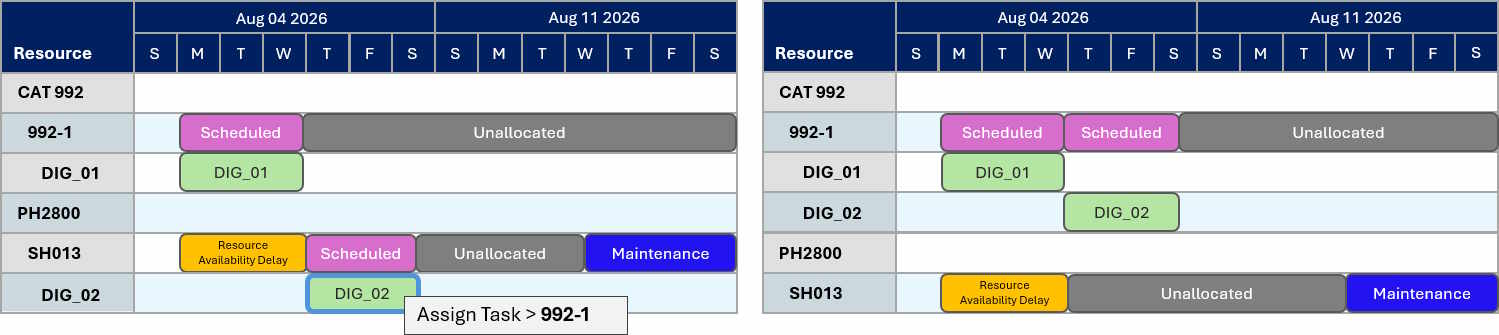
Reassigning DIG_02 to 992-1 using the right-click menu option
You can remove or deallocate a productive task from a resource. Below the resource, right-click the assigned task, then select Remove.
By default, a resource performs 100% of its assigned activity area. However, there are situations where a resource should perform only a certain percentage of the activity area. In this case, the resource could return to and perform the remaining portion of the activity area after performing other activity areas.
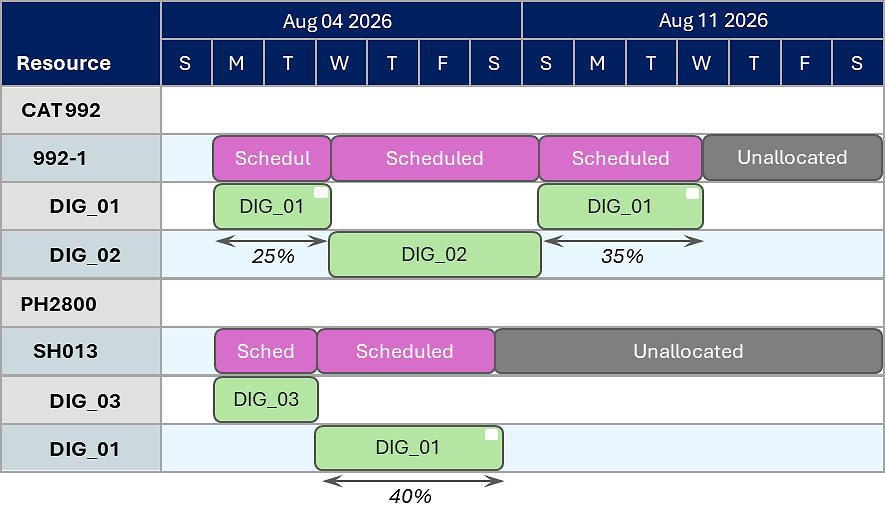
DIG_01 has a split allocation. In the first instance, the resource performs 40% of it.
In the second instance, the remaining portion is performed.
The other portion of the activity area could also be allocated to another resource.
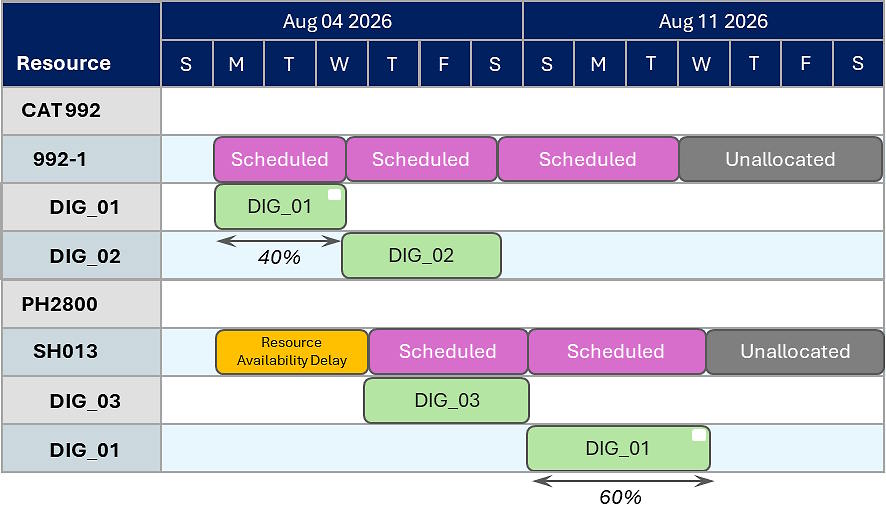
DIG_01 has a split allocation. 992-1 performs 40% of it, and SH013 performs the remaining portion.
Tasks with split allocations have a white square on the top-right of them.
To split a task
You split a task by defining a percentage or quantity of the task. The task will be split at this point. The first split task inherits these values, while the other split task inherits the remainders. Split tasks can be split into further tasks.
After splitting a task, you can allocate it to another resource – or reposition it amongst the current resource’s tasks.
On the Gantt, chart, right-click an activity area task, then select Split Task.
Configure the split properties, defining how far along the original task it becomes split.
Click Split.
|
For Task |
|
|
This section specifies the task that will be split, detailing its quantities and start and end dates. Refer to these fields to help you select a valid and required quantity or date for splitting the task. |
|
|
Spit At |
|
|
An example of splitting a task When you update the Percent or Quantity field, the other field automatically updates to align with the new value. |
|
|
Percent |
Defines the point at which the task splits, expressed as a percentage of the total task quantity. |
|
Quantity (t) |
Defines the point at which the task splits, expressed as a mined quantity—of the total task quantity—in tonnes. |
|
Date |
Defines when the task splits, as a date. The date must be within the start and end dates of the original task. Use the calendar control to select a date, which shows only dates within the valid range. |
You can modify how much a resource schedules an activity task area.
To modify how much a resource schedules an activity area task
On the Gantt chart, right-click an activity area task, then select Adjust Allocation.
On the dialog, set the Allocate value to the percentage that reflects how much of the task the resource will schedule.
Click Adjust.
Once you set a task’s allocation percentage to less than 100%, you can quickly create a task for the remaining percentage – and allocate it to the same or a different resource. This process involves copying the existing portion and pasting it elsewhere on the chart. The allocation percentage of the pasted task will correspond to the remaining percentage needed to total 100%.
To automatically create a task for the remaining portion, hold Ctrl and drag the task to another position on the chart.
The same task can divided into many tasks, each with different allocation percentages totalling 100%.
DIG_01 is split into three tasks. Its allocation percentages total to 100%.
A delay represents a moment in time when a resource is idle. A delay could represent cleanup of the working area, maintenance of equipment, inspection and safety checks of equipment, and so on.
On the Gantt chart, you can manually insert delays on a resource. Alternatively, you can insert a delay on a resource performing a task, which could occur before, during, or after the task is performed. You choose when the delay occurs and how long it lasts.
Let’s say blasting occurs throughout the schedule. The equipment in the blast radius must not be working during that time to maintain safety. The schedule must reflect the real delay incurred on all affected resources. The downtime of the resources should greater than the blast duration to ensure there’s enough time for resources and personnel to get out of the way and maintain an adequate safety margin. You can quickly schedule the resource downtime using time-based delays.
To insert a delay, right-click any activity area task on the chart, then select:
Insert Time-Based Delay: Adds a delay to the specified resources, giving them downtime for the defined duration.
Insert Task-Based Delay: Adds a delay to the selected activity area task and parent resource. In this case, before, during, or at some point after performing the task, the resource is delayed for the defined duration.
You can implement a time-based delay that affects a specific resource or a group of resources over a defined duration, with specified start and end dates.
There are instances when a delay needs to be applied to multiple resources, such as due to weather events, public holidays, or geotechnical issues. These problems can arise unexpectedly and may be short-term. Therefore, you can create a delay for several resources at once, rather than having to do it one by one.
The delays are treated as a group. When you select or edit one delay of the group, the other delays within the group are selected or edited, too.
The result of adding a Maintenance delay to several resources.
After implementing the delays, you can individually edit each one.
|
Insert Time Based Delay |
|
|
The duration is counted from the start date. After you adjust the Duration or End Date field, the other field adjusts accordingly to match the length. |
|
|
Start Date |
Defines the date at which the delay begins. |
|
Duration |
Defines the length of the delay, in terms of days, hours, and minutes. |
|
End Date |
Defines the date at which the delay ends. |
|
Description |
Defines the label of the delay. The label is annotated on the associated task bars. |
|
Work Category |
Assigns the delay to a work category. A category tracks a set of common non-productive times, such as maintenance, shift changes, or blast delays. Prepared in Work categories. |
|
Resources To Delay |
|
|
You can create a delay for several resources. Once created, they behave as individual delays. |
|
|
Delayed Resources |
Defines the resources that will inherit the delay. |
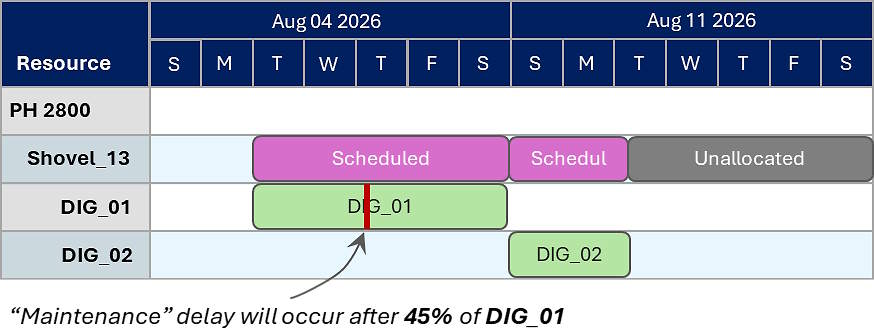
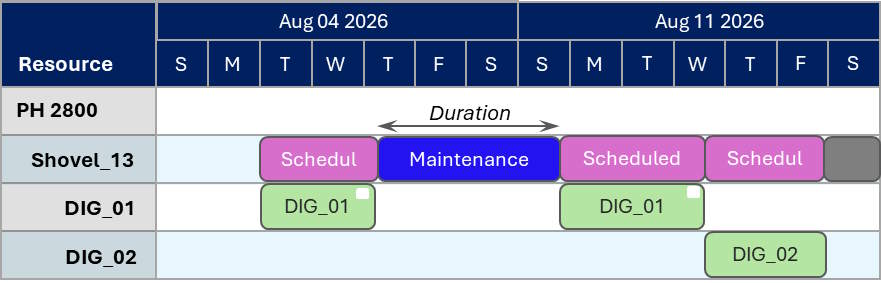
You can implement a task-based delay, whereby the resource performing the selected task is delayed. The delay occurs before, during, or after the activity is performed.
|
Insert Task Based Delay |
|
|
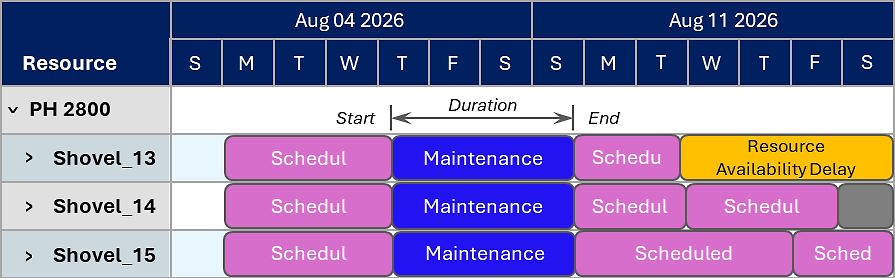
If the delay occurs at some point during the task (the Delay After percentage is above 0 and below 100), the task becomes split. The first split portion ends when the delay begins. The second split portion starts when the delay ends.
The result of adding the Maintenance delay |
|
|
Delay After |
Defines when the activity occurs, as a percentage of the total duration of the task. If you enter:
|
|
Duration |
Defines the length of the delay, in terms of days, hours, and minutes. |
|
Description |
Defines the label of the delay. The label is annotated on the associated task bars. |
|
Work Category |
Assigns the delay to a work category. A category tracks a set of common non-productive times, such as maintenance, shift changes, or blast delays. Prepared in Work categories. |
A resource has a production rate, which defines the speed at which it performs a productive task – such as mining at 1,500 tonnes per hour.
For information about the logic behind production rates, refer to Resources (Production Rates).
The resource’s actual production rate, as well as the scheduled quantity of the activity area, determines how long it takes for the resource to complete the task.
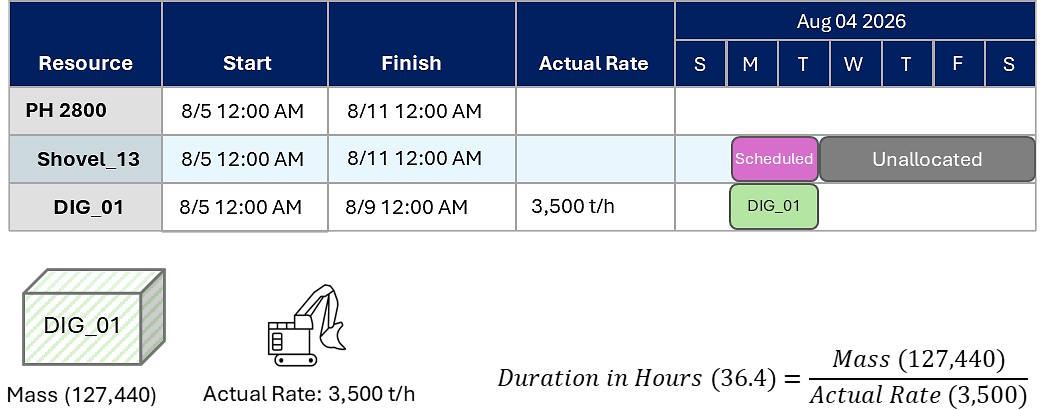
Consider this example.
A resource’s actual production rate is 3,500 t/h.
The volume of an activity area is 54,000 m3, and its density is 2.36.
The activity area’s mass is 127,4000 (Volume × Density).
To determine the number of hours it takes for a resource to schedule its allocated activity area task, we take the activity area’s mass and divide it by the resource’s actual production rate.
Activity Area Mass (127,4000) / Actual Production Rate (3,500 t/h) = Task Duration (36.4 hours)
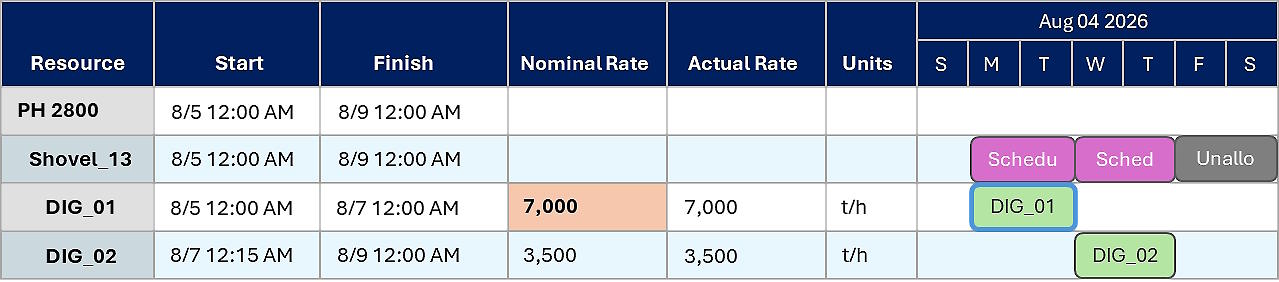
For any resource and activity area combination, you can override its nominal/base production rate – which affects the actual production rate. In this case, the software automatically recalculates the durations of the affected tasks so that they match the new actual rate.
Overridden production rates are highlighted in orange.
To override a nominal production rate
On the chart, locate the resource and activity area combination whose production rate you want to override.
Double-click the Nominal Rate cell, enter a new value, then hit Enter.
To reset the nominal production rate override on a resource and activity area combination, returning to the original production rate, right-click the Nominal Rate cell, then select Reset Nominal Rate to Default.
You can set the completion date of a productive activity. The allocated resource will complete the activity by this date.
If the resource cannot complete the activity by the completion date—performing at its current production rate (speed)—the software automatically overrides and increases its nominal production rate so that the activity can be completed by the date.
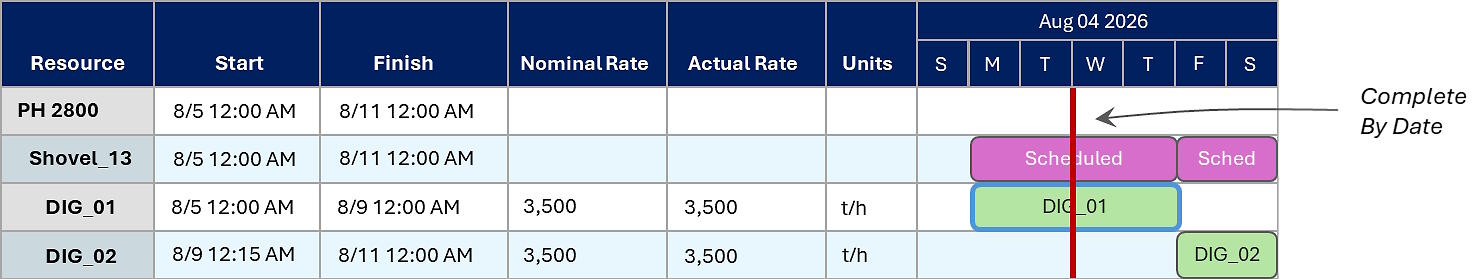
Before setting the completion date
After setting the completion date. the software automatically adjusts the resource’s production rate on that activity to ensure it finishes on time.
In this case, since the task must be completed in half the original duration, the production rate is doubled.
The completion date must be earlier than the original task end date.
Changes to the base/nominal resource production rate made in Config don’t override any manual adjustments to the resource production rate for a task.
Use the playback tools to watch the latest schedule animated within the scene. As the animation plays, the Gantt chart stays in sync, with the play bar scrolling through the chart to indicate the current point in time.
On the toolbar, you can click:
![]() Play – Start the animation from the play bar’s current position.
Play – Start the animation from the play bar’s current position.
![]() Stop – Pause the animation and rewind it to the beginning.
Stop – Pause the animation and rewind it to the beginning.
![]() Calendar – Jump to a specific date by selecting it. The play bar and animation will update accordingly.
Calendar – Jump to a specific date by selecting it. The play bar and animation will update accordingly.
You can drag the play bar along the chart, fast-forwarding or rewinding to any point in the animation.
A milestone represents a task that cannot be started because it has already been fully mined. This typically occurs when earlier instances of the same task on the Gantt chart have cumulatively reached 100% mined.
Milestones are displayed as diamond-shaped markers, indicating they:
Are 100% complete
Have no duration
Serve as reference points rather than active tasks.
When you make changes to the schedule, the software may concurrently run two schedules: a timeline schedule and a Product Optimiser schedule.
A timeline schedule manages the mining operations. It is triggered when changes affect operational aspects, such as reordering tasks on the Gantt chart.
Once the full schedule is generated, its results are used to populate schedule reports and closing balance reports. These results are also published to EPF via the data feed out. The full schedule runs on the XECUTE server and pushes results to connected clients.
You can monitor the progress of generating a schedule via the status bar:
An animated progress icon indicates the current status.
Hover over the icon to view more details, including the current stage and the last time the schedule was run.
Any schedule errors can be copied to the clipboard.
See Events tab for details on user actions that can trigger a schedule update. If you can’t see the status bar, you may need to reset the application’s dock state. Right-click the title bar (at the top of the application), then select Reset Default Layout.
Each task or delay on the Gantt chart includes a tooltip that displays key details about the item, such as the actual equipment utilisation and the production rate applied during that task.
Hover your cursor over a task to reveal its tooltip.
|
Property |
Description |
|---|---|
|
Start Date |
The date that the task begins. |
|
End Date |
The date that the task ends. |
|
Duration |
The total length of the task. |
|
Percent |
The percentage of the task completed in this instance. Other instances may exist, and together they total 100% mined. |
|
Effective Utilisation |
The percentage of available operating time during which the resource is actively performing its assigned activity. This varies by period and is determined by availability, efficiency, and utilisation factors on the Resources tab. Summary tasks may show lower effective utilisation, as they encapsulate idle time due to delays. For more details, see Reported effective utilisation above. |
|
Production Rate (Actual) |
Reflects the real output achieved during a task, accounting for any delays or reductions in equipment performance. For information on how the actual production rate is determined, refer to Resources (Production Rates). |
Sometimes, the Gantt chart can become out of sync with the server-side schedule. To realign the local schedule without clearing the schedule cache, right-click the Gantt chart and select Force Reset Gantt. This action refreshes the schedule locally without triggering a server-side re-run. It reconstructs the timeline based on the current inputs to ensure the display is accurate and up to date.
The Gantt settings filter the rows displayed on the chart. To open the settings, on the toolbar, click Settings![]() .
.
|
View |
|
|
View |
Controls whether the Gantt chart uses the default or a custom layout.
For more information about the grid layout, see Customised layout below. |
|
Expression Filter |
|
|
Expression Filter |
Controls which rows are displayed on the Gantt chart by applying logical conditions. These conditions are built using a block editor or a custom expression editor. |
|
Visible Resources |
|
|
Name |
Controls which resources are displayed on the Gantt chart. Tasks without the selected resources are hidden. |
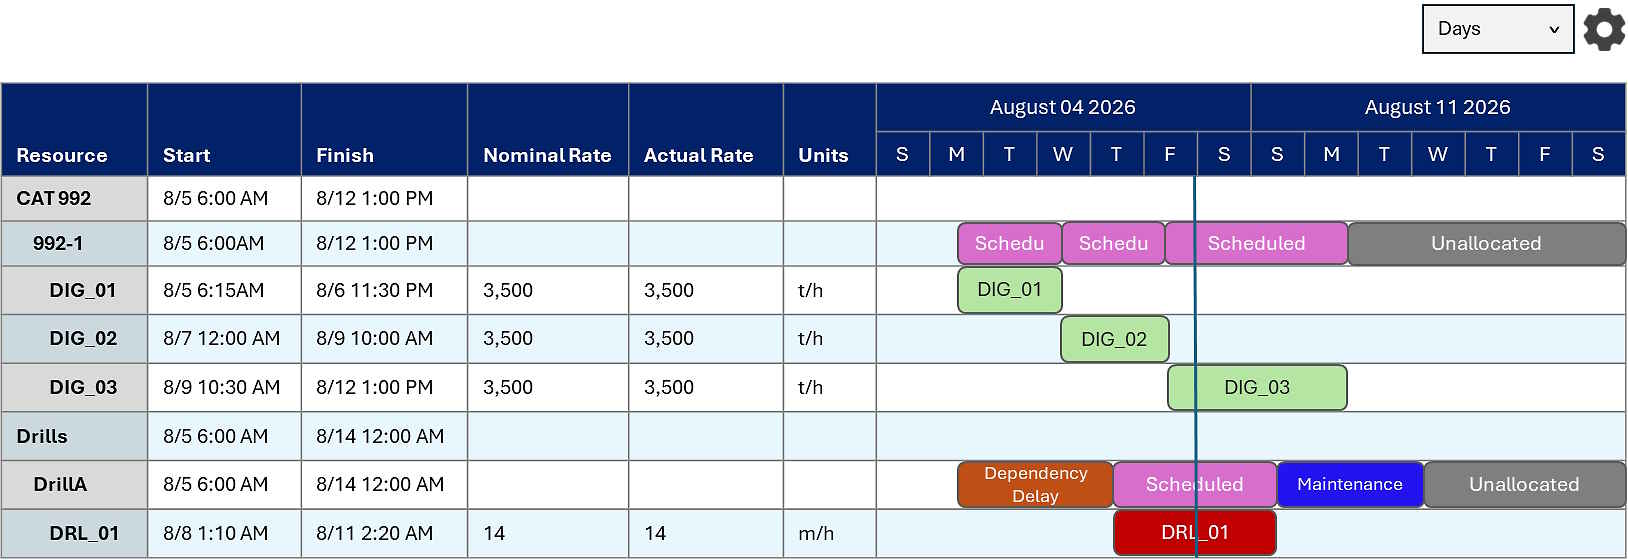
When using the Grid layout, the Gantt chart displays data in a flat, non-nested format. Each row represents a unique resource–activity area combination, and task bars indicate when that specific combination is active.
You can tailor the chart’s appearance by customising the columns and sorting order.
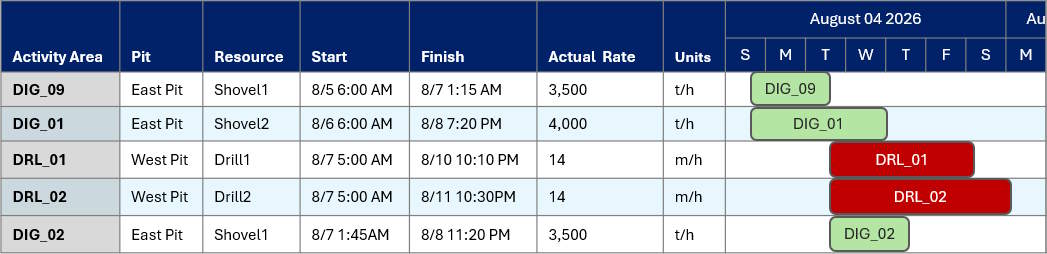
To use a customised layout, set View to Grid, then go to the Grid tab.
Using the Columns list, you control which attributes are visible for each row. You can add or remove columns from the chart and change the field displayed in each column.
Using the Column Sorting list, you define how rows are ordered. Rows can be sorted by any attribute currently displayed on the chart. The first listed attribute determines the primary sort order (ascending or descending). Rows with matching values are then sorted by the second attribute, and so on.
The Gantt chart supports multiple levels of time granularity, allowing you to view and evaluate tasks with the level of detail that best suits your planning needs.
When you select a granularity level, the Gantt chart automatically updates to reflect that level of detail. This affects the scale of the timeline and alignment of tasks within time intervals. This helps you zoom in for detailed scheduling or zoom out for high-level planning.
Available granularity levels include:
Minutes
Hours
Days
Weeks
Months
Periods (the time intervals defined in the active scheduling calendar)
On the toolbar, select a granularity level from the list of levels.
The Gantt chart can be exported as a *.png image that captures the tasks occurring within a specified date range. This range must fall entirely within the scheduled period – dates outside the schedule cannot be selected.
The export functions as a direct screenshot of the chart. It includes all fields and rows currently visible in the user interface and reflects the current level of granularity, whether that’s minutes, days, or months, and so on.
To initiate the export, right-click the chart, then select Export. Select the start and end dates, then click Export. Use File Explorer to choose a file name and save location. The resulting image provides a clear, shareable snapshot of the chart as it appears on screen.